Energy Consumption Data Analysis Platform
Collects real-time data from the project site and transmits it to the cloud server through an encrypted channel. Authorized users on the cloud platform can access via PC or mobile APP
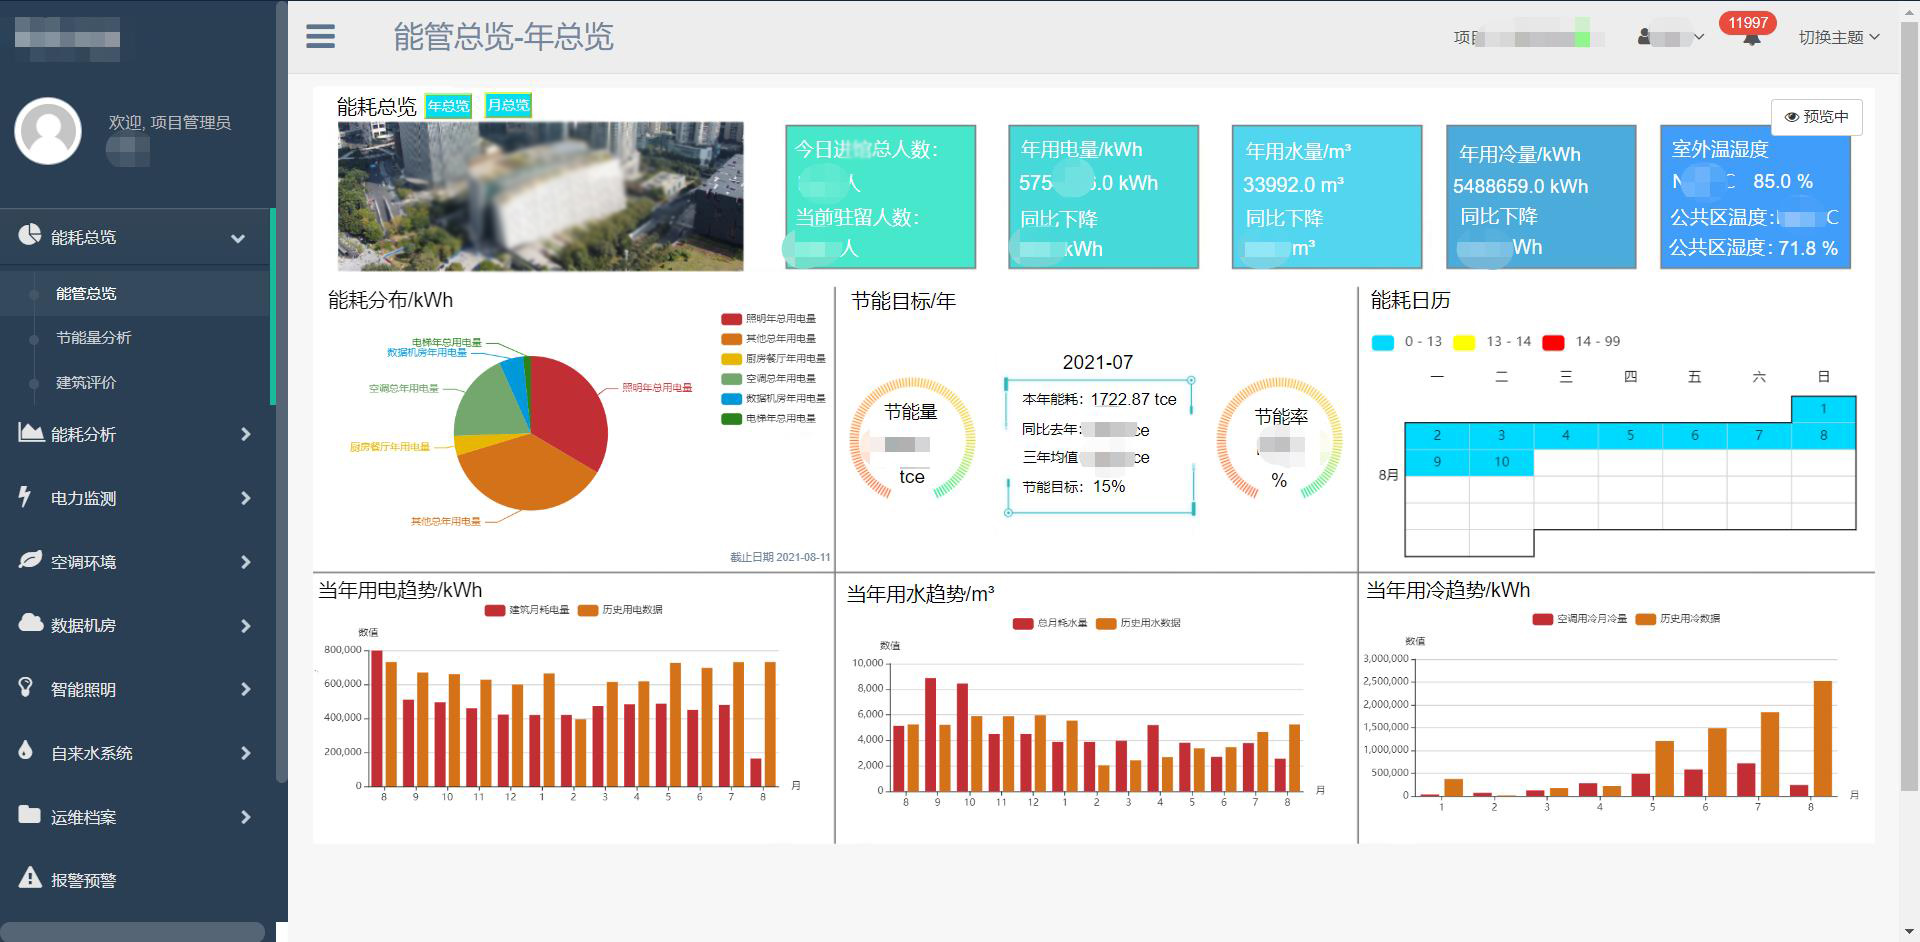
The platform provides rich data visualization functions, presenting data to users in an intuitive way through pie charts, bar charts, line charts, calendar charts, custom configuration views, etc., facilitating user decision-making.
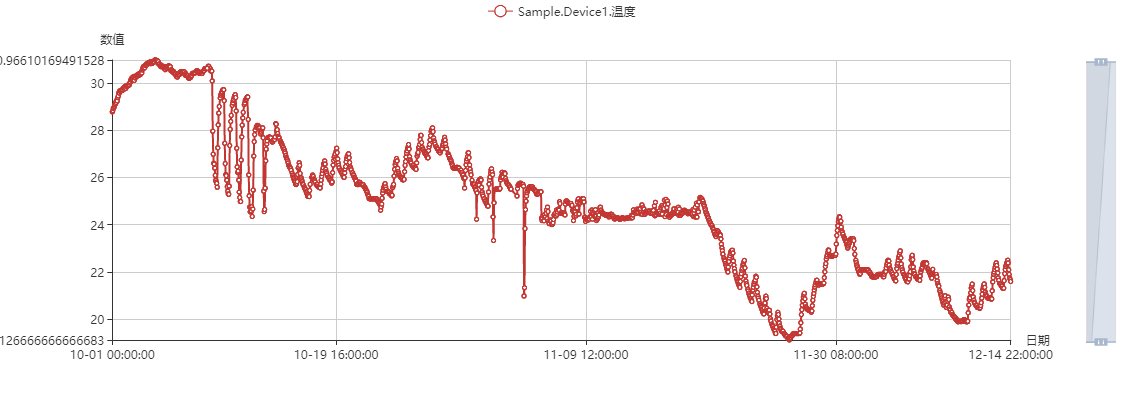
 Temperature change data statistics for Guangzhou from October 1 to December 14, 2017, accurate to the hour
Provides equipment management and maintenance record functions to help users understand the lifecycle and health status of various equipment in the project.
Provides various energy consumption analysis reports, statistically analyzing user energy consumption from multiple dimensions. Reports can provide year-on-year analysis, month-on-month analysis, floor energy consumption analysis, water/electricity/gas classification energy consumption, energy consumption ranking analysis, etc.
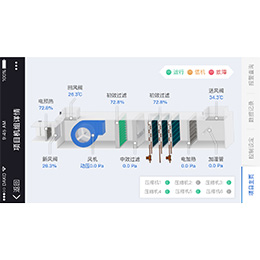
Separate monitoring for equipment with high energy consumption, such as central air conditioning systems. The system can not only monitor the operating parameters of various parts of the central air conditioning but also calculate the energy efficiency of the central air conditioning based on its operation efficiency, and compare the energy efficiency value with energy efficiency standards, thereby reflecting the true energy efficiency state of the central air conditioning. It can provide energy efficiency comparison before and after energy-saving renovations of central air conditioning, thus verifying whether the renovation is effective.
The platform provides rich data visualization functions, presenting data to users in an intuitive way through pie charts, bar charts, line charts, calendar charts, custom configuration views, etc., facilitating user decision-making.
 Temperature change data statistics for Guangzhou from October 1 to December 14, 2017, accurate to the hour
Provides equipment management and maintenance record functions to help users understand the lifecycle and health status of various equipment in the project.
Provides various energy consumption analysis reports, statistically analyzing user energy consumption from multiple dimensions. Reports can provide year-on-year analysis, month-on-month analysis, floor energy consumption analysis, water/electricity/gas classification energy consumption, energy consumption ranking analysis, etc.

Separate monitoring for equipment with high energy consumption, such as central air conditioning systems. The system can not only monitor the operating parameters of various parts of the central air conditioning but also calculate the energy efficiency of the central air conditioning based on its operation efficiency, and compare the energy efficiency value with energy efficiency standards, thereby reflecting the true energy efficiency state of the central air conditioning. It can provide energy efficiency comparison before and after energy-saving renovations of central air conditioning, thus verifying whether the renovation is effective.
-
Technologies
-
Client
Certain Automation Control Technology Company
- Guangzhou, Energy Consumption Analysis Platform, Energy Consumption Analysis Monitoring, Energy Supervision Platform, Data Analysis, Custom Development, Industrial Internet of Things, IoT
- 2017

